
Vancouver Island Tax Roll Audit 2026
Every home that sold on Vancouver Island in 2025, checked against what BC Assessment said it was worth.
The 2026 assessment roll reflects market value as of July 1, 2025. This audit tested that roll against real arm's length MLS® sales, one taxation jurisdiction at a time.
If you bought a home on Vancouver Island in 2025, the roll matched what you paid 63 times out of 7,079. Every other buyer was assessed either under or over their own sale price. What is left is by how much, and which side you landed on.
7,079MLS® sales tested
7Regional Districts on Vancouver Island
73Tax Jurisdictions
0.9%Matched the price the buyer paid
2026 roll · January 2026
2027 roll · January 2027
2028 roll · January 2028
Vancouver Island 2026 Property Tax Assessment Audit2025 single family detached sales, all 7 regional districts
7,079 homes sold63 of the 7,079 homes that sold 0.9% were valued at exactly what the buyer paid, which is what the law requires.*
The other 7,016 (99.1%) missed. 4,211 (59.5%) were under assessed. 2,805 (39.6%) were over assessed.
The amount of tax collected does not change. A home assessed too low pays less than its share. A home assessed too high pays more, and carries part of what the under assessed homes did not.
* What the law requires. Every home must be assessed at its actual value, which the Assessment Act defines as market value. For a home that sold at arm's length, the Property Assessment Appeal Board has held that the sale price is the best evidence of that value, and has set the assessment at the sale price regardless of the Assessor's median and dispersion statistics. For a 2025 sale, what bridges the sale and the July 1, 2025 valuation date is market movement over that time, which is the accumulation of the individual MLS® sales. Across all 7,079 sales, the monthly median moved 2.2 points over the whole year. It cannot explain assessments that run from 31.2% to 176.4% of what buyers paid.Assessment Act, RSBC 1996, c. 20, s. 18(1), s. 19(1) and s. 19(13). Kerzner, et al. v. Area 09, 2023 BCPAAB 20231949, paras. 21, 25 and 29.
Lowest 31.2%100% · what the buyer paidHighest 176.4%
Lowest and highest come from the communities inside this area. The dark mark is the ASR median at 98.4% of sale price. The arrow means the true value runs past the edge of the scale.
Under assessedmatchOver assessed
Exact sold price match630.9%
Under assessed
Under 5% below2,01428.5%
5 to 10% below1,30118.4%
10 to 20% below71710.1%
20 to 50% below1702.4%
More than 50% below90.1%
Over assessed
Under 5% above1,51621.4%
5 to 10% above6769.5%
10 to 20% above4496.3%
20 to 50% above1542.2%
More than 50% above100.1%
Under assessed · below the sale price$348.7M$52,000 for a typical under assessed home
Over assessed · above the sale price$182.9M$41,000 for a typical over assessed home
Tax that moved onto other owners$1,811,622$430 on average for an under assessed home
Tax carried by over assessed owners$946,525$337 on average for an over assessed home
These are assessed value gaps and the tax they carry, using each jurisdiction's own 2026 combined Class 1 residential rate. Rural rates exclude local service area levies, so those areas are counted at a floor. Both tax totals are the sum of the 7 regional district reports.
51 of the 7,130 sales in this audit are not in these figures: 46 Farm Class properties, 3 carrying no usable 2026 assessed value on the roll, being 2 in the Capital Regional District and 1 in the Town of Qualicum Beach, and 2 within the Ts'uubaa-asatx First Nation, a separate taxing jurisdiction outside the scope of this study.
Show the technical numbers
| Median Assessment to Sales Ratio (ASR) | 98.4% inside the IAAO standard, 90 to 110 |
| Price Related Differential (PRD) | 1.008 inside the IAAO standard, 0.98 to 1.03 |
| Coefficient of Dispersion (COD) | 6.78 inside the IAAO standard, 5.0 to 15.0 |
| The standard being tested against | International Association of Assessing Officers, Standard on Ratio Studies, approved April 2013. Median 0.90 to 1.10 at section 9.1. COD 5.0 to 15.0 for single family residential in older or more heterogeneous areas at section 9.2.2 and Table 1-3. PRD 0.98 to 1.03 at section 9.2.7. The standard states its own use is advisory and voluntary, and that where it conflicts with law, the law governs. |
| Range of ASR, lowest to highest | 31.2% to 176.4% |
| What 100% means | An ASR of 100% is an assessment equal to the price the buyer actually paid. The Assessment Act requires the roll to show actual value, and where a home sold in an arm's length MLS® sale near the valuation date, the Property Assessment Appeal Board has held that the sale price is that value. So for the homes on this page 100% is not a target or an average to aim near. It is the correct answer, and it was already known. |
| Where the 2026 roll landed | Against that measure, 63 of the 7,079 homes tested came out at 100%. The bands below show where the other 7,016 landed, and how far each one sat from the price its own buyer had already paid. Read down each column to see how many homes fell how far from the mark. |
| Under assessed | |
| by less than 5% | 2,014approximately $125 for a typical home |
| by more than 5% | 2,197approximately $506 for a typical home |
| by more than 10% | 896approximately $812 for a typical home |
| by more than 20% | 179approximately $1,555 for a typical home |
| by more than 50% | 9approximately $3,371 for a typical home |
| Over assessed | |
| by less than 5% | 1,516approximately $107 for a typical home |
| by more than 5% | 1,289approximately $468 for a typical home |
| by more than 10% | 613approximately $685 for a typical home |
| by more than 20% | 164approximately $1,066 for a typical home |
| by more than 50% | 10approximately $2,039 for a typical home |
| Most under assessed home | Bald Eagle Cres in Town of Ladysmith, sold $729,900, assessed $228,000 (31.2% of what it sold for) Assessed $501,900 below its sale price, so this owner did not pay $3,177 in tax. Everyone else covered it. |
| Most over assessed home | Enefer Rd in Electoral Area A, Cedar and Yellowpoint and Cassidy, Regional District of Nanaimo, sold $800,000, assessed $1,411,000 (176.4% of what it sold for) Assessed $611,000 above its sale price, so this owner overpaid $2,331 in tax. |
The whole Island at once
How close did BC Assessment get, district by district?
Every MLS® sale in all 7 regional district workbooks that carries both a sale price and a 2026 assessed value. Only an exact match counts as right, because these homes sold on the open market and the price was known.
| Regional district | Homes sold | Exact Sold Price match | Missed by more than 5% | Under assessed | Over assessed | Median ASR | PRD | COD |
|---|---|---|---|---|---|---|---|---|
| Capital Regional District | 2,814 | 22 0.8% | 1,345 47.8% | $168.8M | $80.2M | 98.2% | 1.008 | 6.34 |
| Cowichan Valley Regional District | 992 | 9 0.9% | 516 52.0% | $46.8M | $25.8M | 98.4% | 1.007 | 7.29 |
| Regional District of Nanaimo | 1,811 | 15 0.8% | 874 48.3% | $73.3M | $50.3M | 99.0% | 1.008 | 6.84 |
| Alberni-Clayoquot Regional District | 364 | 6 1.6% | 213 58.5% | $15.3M | $5.6M | 97.3% | 1.010 | 8.59 |
| Comox Valley Regional District | 718 | 9 1.3% | 322 44.8% | $29.9M | $12.9M | 98.4% | 1.006 | 5.78 |
| Strathcona Regional District | 312 | 2 0.6% | 165 52.9% | $12.7M | $6.8M | 98.2% | 1.019 | 8.02 |
| Regional District of Mount Waddington | 68 | 0 0.0% | 44 64.7% | $2.0M | $1.3M | 97.3% | 1.016 | 9.54 |
| Vancouver Island, all 7 | 7,079 | 63 0.9% | 3,479 49.1% | $348.7M | $182.9M | 98.4% | 1.008 | 6.78 |
Dollar figures are assessed value gaps, not tax bills. Median ASR is the middle assessment to sale ratio. PRD is the price related differential, which shows whether cheaper homes are assessed higher against their sale price than expensive ones. COD is the coefficient of dispersion, the standard uniformity measure. BC Assessment treats a median ASR of 90 to 110, a PRD of 0.98 to 1.03, and a COD of 5 to 15 as acceptable, so a figure outside those ranges fails on its own terms. The total row is computed from all 7,079 sales directly, and the band counts and dollar totals on the Vancouver Island card at the top of this page are the sum of the 7 regional district cards below.
63 homes out of 7,079 were assessed at exactly what they sold for.
That is 0.9%. Every one of those homes changed hands in an open sale, so the correct value was on the contract. BC Assessment reports that more than 99% of owners accept their assessment as fair and accurate. Records released under freedom of information show that figure counts every property that did not appeal.
Calculated on all 7,079 records that carry both a sale price and a 2026 assessed value. Nothing has been excluded and nothing has been adjusted. The widest results in this study are entries on the 2026 roll exactly as BC Assessment published them. In one case a home that sold for $800,000 carries an assessed value of $1,411,000. Of the 7,130 records in the audit, 46 Farm Class properties, 3 carrying no usable 2026 assessed value and 2 within the Ts'uubaa-asatx First Nation are flagged and set aside from the statistics rather than removed from the record.
Why the Numbers Miss
Why this happens
Two explanations. This audit does not choose between them.
Two people with direct knowledge have offered different accounts of the cause. They are not the same explanation and they may not both be correct.
The BC Assessment Whistleblower Files
In May 2023, during BC Assessment's move from ValueBC to iasWorld, someone working inside the organization described a system that trends assessments toward a target ratio, and said that once the middle of the range looks correct, the homes sitting above and below it stop being resolved.
Those claims were not left as recollection. The migration was tested through freedom of information, and the material was put before the Property Assessment Appeal Board, where the Assessor answered it in writing.
Sources: FOI Case File #2023-11: ValueBC to iasWorld Transition and Software Issues. Assessor’s written response, Green et al. v. Area 04, 2024 PAABBC 20233262.
The BC Assessment Supreme Court Case
Derek Holloway, a retired BC Assessment senior appraiser of 28 years, has argued publicly since 2019 that large commercial owners decline to produce sales and income information under sections 13 to 16 of the Assessment Act, that the power to compel it already exists but is not enforced, and that any resulting shortfall shifts onto the remaining tax base.
On November 20, 2025, BC Assessment filed a notice of civil claim against him in the Vancouver registry. He is defending it.
Source: British Columbia Assessment Authority v. Derek Holloway, Supreme Court of British Columbia, Vancouver Registry, No. S-258728.
This audit measures the outcome. Deciding which explanation is correct, or whether either is, would require an independent examination. That examination has never been done.
The Sidney Appeal
Where this started
Sidney’s highest assessed home was valued at approximately $7.0 million. More than $2.1 million has already been removed, and the final appeal decision is still to come.
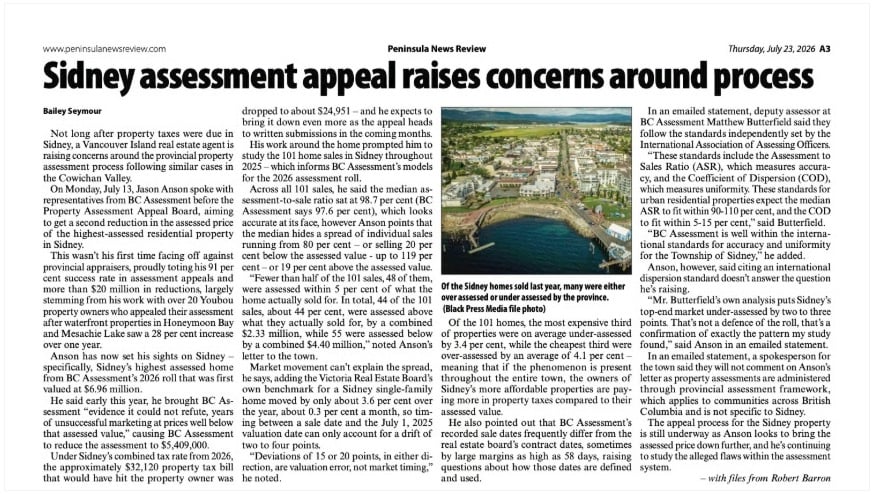
Sidney assessment appeal raises concerns around process, Bailey Seymour, Peninsula News Review, July 23, 2026, page A3.
Who Was Asked
The accountability chain
Everyone was asked. Here is what each one said.
The municipalityTown of Sidney
The July 9, 2026 letter and Exhibit A, the study of all 101 Sidney single family sales in 2025, were sent to Mayor and Council. Asked about it by the Peninsula News Review, a spokesperson said the Town would not be commenting, on the basis that property assessments are administered provincially under a framework that applies across British Columbia and is not specific to Sidney.Read the July 9, 2026 letter to Sidney Mayor and Council
Response reported in Sidney assessment appeal raises concerns around BC Assessment process, Bailey Seymour, Peninsula News Review, July 21, 2026.
Response reported in Sidney assessment appeal raises concerns around BC Assessment process, Bailey Seymour, Peninsula News Review, July 21, 2026.
BC AssessmentDeputy Assessor
Matthew Butterfield, Deputy Assessor for Vancouver Island, was copied on the July 9, 2026 letter and Exhibit A, and again on the July 22, 2026 follow up to the Minister of Finance. In an emailed statement to the paper, Mr. Butterfield said BC Assessment follows standards set independently by the International Association of Assessing Officers, and that for urban residential properties those standards expect a median Assessment to Sales Ratio of 90 to 110 percent and a Coefficient of Dispersion of 5 to 15 percent. He added that BC Assessment is “well within the international standards for accuracy and uniformity” for Sidney. The IAAO states its standards are voluntary. BC Assessment's own Appraisal Tolerance and Equity Range Policy states in writing that it is not binding, and that the law and the Property Assessment Appeal Board prevail over it.Source: Sidney assessment appeal raises concerns around BC Assessment process, Bailey Seymour, Peninsula News Review, July 21, 2026.
Minister of FinanceProvince of BC
Copied on the July 9, 2026 letter to Sidney's Mayor and Council and on Exhibit A. A follow up letter was sent on July 22, 2026, asking directly what the Ministry is prepared to do about a pattern of roll wide inequity that neither of the other two parties will own. Copied to the Town of Sidney, MLA Heather Maahs and Mr. Butterfield. No response to date.Read the July 22, 2026 letter to the Minister of Finance
Property Assessment Appeal BoardThe only body with the power
The Property Assessment Appeal Board has statutory authority under the Assessment Act to go beyond correcting a single assessment and, where the statutory requirements are met, order a broader reassessment. We took the Sidney findings from the Vancouver Island Tax Roll Audit 2026 to the Property Assessment Appeal Board to test whether that evidence is enough to justify a broader reassessment beyond the individual property.The application puts a direct question before the Board: are the Sidney findings strong enough to justify a broader reassessment, rather than simply correcting the one property that was appealed?
Premier's OfficeChapter submissions
Earlier correspondence challenged the Province's characterization of substantial assessment corrections as the result of routine auditing, particularly where reductions followed appeals, additional market evidence and public scrutiny. The Vancouver Island Tax Roll Audit 2026 now tests that explanation against the actual 2026 roll across Vancouver Island. The findings will form part of the next chapter of Over Assessed and Dock Fight, and will be put back to the Premier's Office with supporting evidence and another opportunity to correct any material fact before publication.
The question is whether evidence of a broader pattern is enough to require something more.
The municipality says property assessments are administered provincially. BC Assessment says the roll meets accepted standards. The Ministry has not taken ownership of the broader pattern. The Property Assessment Appeal Board has the statutory power to go beyond correcting one appealed property when the requirements of the Assessment Act are met. We have taken the Sidney findings from the Vancouver Island Tax Roll Audit 2026 to the Board to test that threshold. Individual assessment errors can be corrected. The question now is what happens when the evidence points beyond a single property.
The Standard vs. the Law
One question
These rolls meet the international standard BC Assessment cites. But is this fair?
That standard is the International Association of Assessing Officers Standard on Ratio Studies, approved April 2013. It asks for a median Assessment to Sales Ratio between 90% and 110%, a Coefficient of Dispersion between 5.0 and 15.0, and a Price Related Differential between 0.98 and 1.03. Vancouver Island passes all three: a median of 98.4%, a COD of 6.78 and a PRD of 1.008.
None of that is the law. The Assessment Act requires the roll to show actual value. The IAAO standard says on its own opening page that compliance with it is voluntary, and that where any part of it conflicts with national, state or provincial law, the law governs. BC Assessment's own Appraisal Tolerance and Equity Range Policy says the same, on every page: it is not binding, and the legislation and the case law prevail over it. So passing the standard does not answer the question of whether individual assessments are fair.
For a home that sold, we have something much simpler to compare against: what a buyer actually paid. The Property Assessment Appeal Board has held that where an arm's length MLS® sale exists near the valuation date, the sale price can establish the value, and ordered an assessment reduced to it regardless of the ASR and COD the Assessor cited. That is why this audit compares assessments directly with actual sale prices.
BC Assessment determines the assessed values. BC Assessment answers to the Minister of Finance. Municipalities and regional districts then use the completed assessment roll when property taxes are calculated and collected. Each has a different role, but the homeowner ultimately receives one tax bill based in part on the assessed value assigned to the property.
Sidney shows why the distinction matters. BC Assessment, through Deputy Assessor Matthew Butterfield, said the 2026 roll meets International Association of Assessing Officers standards for accuracy and uniformity across the municipality as a whole. The Town of Sidney said it will not comment, because property assessments are administered through a provincial assessment framework that applies across British Columbia and is not specific to Sidney. The Minister of Finance, the party BC Assessment answers to, has not responded to the broader concerns raised.
But the question is much simpler. Across the Island, 63 of 7,079 homes that sold were assessed at exactly what the buyer paid. 4,211 were assessed below their sale price and 2,805 above, in the same roll, in the same year, for the same type of property. Nobody, including BC Assessment, has disputed a single sale by sale figure.
On the tercile pattern: where this study describes BC Assessment's own figures as confirming the pattern it found, that is a characterization of what those figures show. It is not a separate admission by anyone at BC Assessment.
Sources: IAAO, Standard on Ratio Studies, approved April 2013, which is where the median, COD and PRD thresholds are set. IAAO, Standard on Mass Appraisal of Real Property, which cites those thresholds rather than setting them. BC Assessment, Appraisal Tolerance Equity Range Policy.
What the tolerance actually is
There are three different standards, and only one of them applies to a home that sold.
Assessment tolerance is not a single number. It changes depending on what evidence exists for the property in question, and both the courts and the Property Assessment Appeal Board have said so.
Tier 1
What BC Assessment cites
Median ASR 90 to 110%
PRD 0.98 to 1.03
COD 5 to 15%
These standards for urban residential properties expect the median ASR to fit within 90-110 per cent, and the COD to fit within 5-15 per cent.Matthew Butterfield, Deputy Assessor, BC Assessment
BC Assessment is well within the international standards for accuracy and uniformity for the Township of Sidney.Matthew Butterfield, Deputy Assessor, BC Assessment
All three describe a whole community at once. Mr. Butterfield cited the median Assessment to Sales Ratio and the Coefficient of Dispersion. The Price Related Differential is the third test in the same standard, and this audit reports it alongside the other two. The standard is a voluntary guideline from a private association, and BC Assessment's own policy states it is not binding.
Quoted in the Peninsula News Review, July 21, 2026. Thresholds from IAAO, Standard on Ratio Studies, approved April 2013, at sections 9.1, 9.2.2 and 9.2.7 and Table 1-3.
Tier 2
What the courts allow for a home that did not sell
Approximately 5%
Where value has to be estimated, appraisal tolerance applies. In Bentall Retail Services v. Assessor of Area 09, 2006 BCSC 424, the Court was provided with summaries of 27 previous Board decisions on the question of range of values and found that the vast majority suggest an approximate range of plus or minus 5% of assessed value as being within an acceptable range of actual value. The Court also held that appraisal tolerance and range of values are the same principle, and that neither requires expert evidence to invoke.
2006 BCSC 424 at paras. 85 to 87, 96 and 102. Supreme Court of British Columbia.
Tier 3
What applies to a home that actually sold
Nothing. The sale price is the value.
Where an arm's length MLS® sale exists at or near the valuation date, the Property Assessment Appeal Board has held there is "no need to default to a range of appraisal tolerance". In Kerzner v. Area 09, the Assessor cited a median ASR of 96.2% and a COD of 5.8% across 4,026 strata residential sales in the City of Vancouver, both inside the standard. The Board ordered the assessment reduced to the sale price anyway, "regardless of the ASR and COD data cited by the Assessor", and warned that using appraisal tolerance to justify an unreasonable outcome is a gross misinterpretation of the concept.
2023 BCPAAB 20231949 at paras. 25, 27, 29 and 32. A decision of the Property Assessment Appeal Board, not a court.
Every property in this study sold. All 7,079 of them changed hands in an arm's length MLS® transaction during the year that set the 2026 roll. For those homes there was no estimate to make and no tolerance to fall back on. The price was on the contract.
That is why this page counts an exact match as the only correct answer, and why the aggregate figures BC Assessment cites do not answer the question. Kerzner says plainly that they do not, on a roll that met them.
What the audit found
Four things show up everywhere
01
A roll can pass every test and still be wrong for most homeowners.
In the City of Duncan the median Assessment to Sales Ratio was 99.9% of sale price. The coefficient of dispersion was 8.00 and the price related differential was 1.005. All three sit inside the standards BC Assessment measures itself against. On paper that roll is close to perfect.
In the same city, in the same year, for the same type of home, 13 of 20 homeowners were assessed more than 5% away from what their house actually sold for. The assessments ran from 84.7% to 120.4% of sale price.
This is not a small sample effect. The City of Nanaimo is the largest taxation jurisdiction in this audit at 954 sales, and it returned the tightest coefficient of dispersion on the Island at 5.82, alongside a median of 99.1% and a price related differential of 1.008. Those are the best uniformity figures anywhere in the study. 409 of those 954 homeowners were still assessed more than 5% away from their own sale price, and the assessments ran from 46.5% to 145.4%.
It holds nearly everywhere. Of the 51 taxation jurisdictions with 15 or more sales, 49 pass all three tests. Every one of those 49 still missed between 34% and 73% of its homeowners by more than 5%.
Both things are true at once. The measures used to check the roll do not detect what individual homeowners experience, and no independent body has ever asked whether they should.
02
BC Assessment's own sale dates often do not match the real contract date.
Assessments are anchored to a July 1 valuation date, so the date a home sold matters. Across the Island, the sale date BC Assessment recorded matched the contract date on file with the real estate board in 956 of 7,079 sales, which is 13.5%. A further 455 sales carry no BC Assessment sale date at all.
Ten taxation jurisdictions matched on no sale in the entire year. The largest is the City of Port Alberni at 0 of 262, then the Town of Comox at 0 of 172 and the Town of View Royal at 0 of 57. In the Town of Sidney the dates matched on 34 of 97 sales, and the widest gap between the two records was 176 days. In the Town of Lake Cowichan they matched on 5 of 68, with a widest gap of 102 days.
03
Most homes cannot be checked at all.
Only a small share of homes sell in any year. In the Town of Sidney, 97 single family homes sold in 2025 out of approximately 2,080, which is under 5%. Every other home was valued by a model calibrated on the ones that did sell.
That is what makes the tested sales worth looking at. They are not a sample of the roll. They are the evidence the rest of the roll was built from. If the homes with a known correct answer show this spread, the homes without one were valued by the same method, against the same sales.
04
The market moving through the year does not explain it.
Assessments are set as of one date, July 1, so a fair question is whether the spread is just homes selling at different points in a changing market. It is not, and the sales answer it themselves.
Median ratios were calculated month by month, by actual contract date, across all 7,079 sales. The monthly median moved 2.2 points over the entire year, from a low of 97.7% to a high of 99.9%. Individual assessments within those same 7,079 sales run from 31.2% to 176.4%, a spread of 145 points.
A market that moves 2 points across a year cannot produce a 145 point spread between the homes inside it. Whatever is producing that spread, it is not the calendar.
Local Government Route
The other way this can be fixed
The municipal route
A local government can put this to the Province through its own channel. A council or board passes a resolution, it goes to the Association of Vancouver Island and Coastal Communities, and if endorsed there it goes to the Union of BC Municipalities, and from there to the Province. That channel is open to every jurisdiction on this page, through its own council or through the regional district board that holds its seat.
It has been used for assessment before. At the 2026 AVICC convention, 6 resolutions on assessment or property taxation were endorsed. Every one of them was about classification, which class a property sits in. None was about valuation, whether the assessed number matches what the property is worth. The same is true of the earlier resolutions the Union of BC Municipalities cites as its standing policy on this subject.
So the channel exists, it is active, and this question has never been put through it. Each stage below is recorded as it happens, or does not.
September 11, 2026Each jurisdiction receives its own figures and the question. Delegation requests are filed the same week.
September and October 2026Delegations to councils and boards as they are granted. Responses and presentations are added to the record as they occur.
No reply deadlineResponses are recorded whenever they arrive. Answered, acknowledged or no response, the record remains open.
November to December 2026Delegations and responses continue through the end of the year where councils and boards choose to consider the findings.
January 2027A council or board that wishes to carry it forward passes a resolution at a January meeting.
February 12, 2027AVICC resolution deadline. Nothing filed after this date reaches the convention.
April 16 to 18, 2027AVICC convention, Nanaimo. Resolutions endorsed here go forward to the Union of BC Municipalities.
September 20 to 24, 2027UBCM convention, Whistler. The last step before the Province. This route runs once. It is not repeated.
March 31, 2028The response record closes. The application to the Auditor General is filed on what every jurisdiction did or did not say, and on how far, if at all, the question travelled.
The record
Response record
Every taxation jurisdiction on Vancouver Island received its own figures and one question on September 11, 2026. Every response, and every absence of one, is recorded on that community's own card below, alongside the numbers it was asked about. There is no reply deadline. Responses received at any point are added to the record. The record closes March 31, 2028, and the application is filed on what it holds that day.
Sources: 2026 AVICC Resolutions Disposition, resolutions R20, R21, R26, R27, R34 and LR1. UBCM 2026 Resolutions Book, Resolutions Committee comments. The AVICC resolution deadline is February 12 and the 2027 convention is in Nanaimo, April 16 to 18, 2027.
The Provincial Route
The provincial route
Every Vancouver Island MLA received the findings for their riding
Local governments issue the tax bills, but they do not prepare the assessment roll. BC Assessment does. It is a provincial Crown corporation operating under provincial legislation. That means there is another group that can ask questions about what this study found: the elected Members of the Legislative Assembly whose constituents paid the taxes.
On September 14, 2026, every MLA representing Vancouver Island received the findings for the taxation jurisdictions within their riding. Each received a cover letter, the relevant jurisdiction reports, and a link to the complete Vancouver Island study published here.
The issue put to them is the same one the underlying reports test. The Assessment Act requires assessments to reflect actual market value applied consistently. For a home that actually sold, there is direct market evidence of what a willing buyer paid. The Property Assessment Appeal Board has also held that a taxpayer is entitled to the lower of market value or equitable value and that appraisal tolerance cannot be used to justify an unreasonable result.
The reports show the result sale by sale. They identify homes assessed above what buyers paid, homes assessed below what buyers paid, and the resulting movement of tax burden between property owners. The question put to each MLA is direct: Are you satisfied that the property owners in your riding paid a fair share of the 2026 property tax, yes or no?
This is not a partisan exercise. Every Vancouver Island MLA received the same opportunity to review the evidence, ask questions, request answers and put their position on the record. Each response, and each absence of one, will be recorded here.
September 14, 2026
Every Vancouver Island MLA received a riding specific package containing the reports for the taxation jurisdictions within their riding and a link to the complete Island wide study.
Minister of Finance
The completed study was provided directly to the current Minister of Finance. Earlier municipal correspondence carried the name of the previous minister because the study took several months to complete and the portfolio changed before release. The provincial record was corrected in the September 14 correspondence.
The question
Each MLA was asked one direct question: Are you satisfied that the property owners in your riding paid a fair share of the 2026 property tax, yes or no?
No reply deadline
Responses are recorded whenever they arrive. Acknowledged, answered, referred elsewhere or no response, the record remains open.
Questions and referrals
If an MLA raises the findings with BC Assessment, the Minister of Finance, another ministry or another public body, that action and any response received are added to the record.
Public record
Every substantive response is published alongside the riding and the taxation jurisdictions it concerns so the position taken can be compared with the evidence the MLA received.
March 31, 2028
The provincial response record closes. The independent review applications are filed on what the elected representatives were shown, what they did or did not do with it, and whether any provincial body took responsibility for examining the broader pattern.
The record
MLA response record
Every Vancouver Island MLA was provided with the reports covering the taxation jurisdictions within their riding. The complete Vancouver Island study remains available online so every MLA and every member of the public can examine the same evidence. There is no reply deadline. Responses received at any point are added to the record. The record closes March 31, 2028, and the independent review applications are filed on what that record contains.
The provincial packages included the jurisdiction studies already released to local governments, grouped by provincial riding, together with a link to the complete Vancouver Island Tax Roll Audit 2026. Legal authorities relied on throughout the reports include the Assessment Act, Bramalea, Lount, Kerzner and Wilson.
Independent Reviews
Where this goes
Independent review
The municipal and provincial routes create the record. That record will support a request for an independent performance audit by the Auditor General of British Columbia.
The Auditor General will be asked to examine whether BC Assessment is performing as claimed and whether the measures used to describe its performance actually demonstrate accuracy and equity.
System performance
A request to the Auditor General of British Columbia
The Auditor General is an independent officer of the Legislature. The office conducts performance audits examining whether public bodies are achieving what they exist to do.
This request will not ask the Auditor General to determine the correct assessed value of 7,079 properties. It will ask whether the assessment system itself is performing as claimed and whether the public measures used to demonstrate that performance actually test accuracy and equity.
It will also put the complete response record before the Auditor General: what BC Assessment was shown, what local governments were shown, what Vancouver Island MLAs were shown, what explanations were provided, and whether anyone within the system took responsibility for examining the broader pattern.
The question: Does BC Assessment have reliable evidence that the assessment roll is fair and accurate, and does its public reporting actually measure whether properties are assessed accurately and equitably?
One record. One request for independent scrutiny.
The Auditor General will be asked whether the assessment system is actually performing as claimed.
The performance claim
The 99% figure
BC Assessment reports publicly that more than 99% of owners accept their assessment as fair and accurate. Records released under freedom of information show that figure is not a survey and not an audit. It counts every property that did not file an appeal. In the year in question, 0.9% appealed. Internally, acceptance is defined as a property that received no complaint.
So the 99% figure measures how many people did not object. It does not measure whether the roll is equitable. Whether BC Assessment has reliable evidence of accuracy and equity is one of the questions this study will put before the Auditor General.
Source: FOI Case File #2025-23: The 99% “Fair and Accurate” Claim.
Where the figure travels
The software vendor
BC Assessment’s assessment software is supplied by Tyler Technologies, a company listed on the New York Stock Exchange, under a contract announced in 2016. Tyler publishes a case study on its own website headed BC Assessment Achieves 99% Assessment Acceptance Rate. It states that about 99% of British Columbia’s property assessments are publicly accepted, and that this “can be attributed to quality control and the in-depth assessment development process” carried out in its product.
So a count of properties that did not appeal is published by the assessor as evidence that assessments are fair and accurate, and then cited by its software vendor as evidence that the software works. At no point in that loop is an assessment compared to what a buyer actually paid. That comparison is what this page does, 7,079 times.
Source: Tyler Technologies, BC Assessment Achieves 99% Assessment Acceptance Rate. Tyler Technologies, Inc. trades as NYSE: TYL. Tyler has not been asked about this and has made no statement to this study.
The withheld survey
There was a survey
Two days before that release went out, BC Assessment sent a survey to people who had filed appeals, asking whether its valuations are impartial, whether assessments accurately reflect property values, whether the system is trustworthy, and whether the way properties are valued is fair. Those are the same four themes the public statement rests on.
Those results were requested under freedom of information. The survey report, the data tabulations and the written responses were withheld. Pages 7 to 105 and pages 162 to 170 were withheld as advice or recommendations. Pages 106 to 142 were withheld on that basis and as personal information. That is 145 pages. The Act says a public body must not refuse to disclose factual material, statistical surveys, or reports of field research.
This one is not finished. The withholding is before the Office of the Information and Privacy Commissioner and that review is open. Whatever it returns will be published here, including if it goes against this study.
Source: FOI Case File #2025-34. Survey administered by Leger for BC Assessment, April 2025. Withholding provisions cited by BC Assessment: Freedom of Information and Protection of Privacy Act, sections 13(1) and 22(1). Disclosure requirement cited here: section 13(2).
Community Audit Results
Now one community at a time
Find your community
These are homes that really sold in 2025, every one of them an arm's length transaction on the MLS® system. We compared what each one sold for against what BC Assessment says it is worth on the 2026 roll.
Over assessed means BC Assessment valued the home for more than it sold for. That owner is paying more than their share. Under assessed means it was valued for less. That owner is paying less, and the rest of the town covers the difference.
These homes sold, so the right answer was known. A house listed on MLS® and sold on the open market between a willing buyer and a willing seller has a price on it. That is what the home is worth. Anything other than that number is a miss, and the bar below shows how far each miss went. Green in the middle is an exact match, blue to the left is under assessed, red to the right is over assessed.
Two separate things are often confused here. Appraisal tolerance is approximately 5%, and it exists because a home that did not sell has to be estimated. It does not apply to a home that sold, because there is nothing to estimate. The first band below is marked only to show what would have been let pass had these homes never changed hands.
Market timing is a much smaller number. A sale can drift from 100% because the market moved between the sale date and the July 1 valuation date. Across 2025 the real estate board benchmarks moved approximately 3.6% over the whole year, about 0.3% a month, so timing accounts for a drift of 2 to 4 points at most. It cannot produce a ratio of 80%, 119% or 52%. Deviations of 15 or 20 points, in either direction, are valuation error, not market timing.
Every home below sold on the open market, so no appraisal tolerance applies to it. The Property Assessment Appeal Board has held that where an arm's length MLS® sale exists near the valuation date, the sale price is the value, regardless of the aggregate figures BC Assessment cites. See the three standards above.
Figures are calculated on qualifying arm's length sales. Farm class properties, sales inside a First Nation taxing authority, and sales still being verified against a taxation boundary are flagged and set aside from the statistics rather than removed from the record.
Jurisdictions marked pending have been audited. Their individual reports are being published in sequence.
Capital Regional District
Cowichan Valley Regional District
Regional District of Nanaimo
Alberni-Clayoquot Regional District
Comox Valley Regional District
Strathcona Regional District
Regional District of Mount Waddington
Homeowner Next Steps
In the meantime
An audit takes time. Your next notice will not wait for it.
Assessment appeals do not lower the total amount of tax a municipality collects. Councils set a budget and the rate is calculated to raise it. What appeals change is how that total is divided. If your home is assessed high relative to your neighbours, you are covering part of their share.
Here is what you can check yourself, starting with the internal file BC Assessment holds on your property.
Open the Homeowner's Tool KitMy Record: January 1, 2023 to December 31, 2026
$22.6M+
cut from the values BC Assessment put on homeowners' properties
My 3 largest reductions for a homeowner: $2,063,000, $1,954,000 and $1,438,000
$110K+
in estimated property tax refunds and credits for homeowners
My 3 largest estimated refunds or credits for a homeowner: $10,315, $9,770 and $7,190
40
homeowners I helped appeal their BC Assessment
100% won a reduction. The average homeowner had approximately $566,000 taken off their value and an estimated $2,800 back in property tax.
63
appeals won, out of the 65 those homeowners took to a decision
97% won, at BC Assessment, the Review Panel and the Appeal Board
91%
of written Appeal Board decisions, made by an independent adjudicator, lowered the value
30 of the 33 that went that far
7,079
Vancouver Island home sales I checked against their BC Assessment
Less than 1% were assessed at what they sold for, and 40% were assessed above it
32
news stories about the appeals I helped with
Run more than 400 times in 68 news outlets across BC
23
freedom of information requests to BC Assessment for its records
$11,047.06 in fees BC Assessment estimated to release them. I paid $30 in total, after fee waiver requests on public interest and hardship grounds.
Are You Overassessed?
When BC Assessment gets your home's value wrong, I prove what it is actually worth using real sales of similar homes, so you don't pay more property tax than your fair share.
Jason Anson
I am not a lawyer or an appraiser, and nothing on this site should be considered legal or tax advice. When I help you, you are still the appellant and you file your own appeal. Every result depends on the evidence for that property, and the decision belongs to the Property Assessment Review Panel or the Property Assessment Appeal Board, not to me. My past results do not predict yours, and I cannot guarantee any outcome.
Helping homeowners with property assessment appeals is not a licensed activity in the province of British Columbia. It is not regulated by the BC Financial Services Authority (BCFSA) or the Real Estate Services Act, and it is not considered a real estate service.
I am also a licensed real estate agent with eXp Realty. That work gives me my experience in valuation and market movement, which is the evidence of market value the Review Panel and the Appeal Board weigh. This site and my appeal work are completely separate from eXp Realty. They are not affiliated with, endorsed by or provided through my brokerage, and the views here are my own, not eXp Realty's.
What I write about BC Assessment, the Property Assessment Review Panel, the Property Assessment Appeal Board, the Minister and Ministry of Finance, and the other public offices on this site is my own opinion, and I consider it fair comment on a matter of public interest. My opinions are my honest views, marked as my view, and based on facts anyone can check: Appeal Board decisions, public records and records released under freedom of information. Quotes from documents and news stories are the words of the people quoted. If anything here is inaccurate, let me know and I will correct it.